For MSOs & large provider networks

One care layer for every practice in your network.

myoncare adds a virtual care and medical data layer on top of the EHRs your practices already use. Every site can run remote monitoring and chronic care programs the same way, and leadership sees performance across the whole network.

The challenge

Growth comes from acquisition. Value comes from integration.

Every practice you add brings its own workflows, systems and habits. Without a shared care layer, the same revenue and cost gaps repeat at every site, and leadership can't see them until the quarter closes.
19%

Missed appointments

Typical no-show rate in US primary care, with an estimated $150–200 in lost revenue per missed visit.
Sources: graham-center.org; ahrq.gov; vitalhealthservice.com
25%

Administrative load

Share of practice costs tied up in billing, documentation and phone work instead of patient care.
Source: internal analysis, to be confirmed
CCM

Underused reimbursement

Chronic care management and remote monitoring codes often go unbilled because practices lack a structured, documented workflow.
30days

Avoidable readmissions

Missed follow-up after discharge turns into readmissions that weigh on quality scores and value-based contracts.
The virtual care & medical data layer

One platform,
three beneficiaries.

myoncare sits between your network, your member practices and their patients. Each level gets what it needs from the same data.
Network leadership

MSO & provider network

  • A virtual framework that standardizes care interactions and operational workflows across member practices
  • Structured digital care programs that align care quality from site to site
  • Structured data for analysis and benchmarking
Levers for EBITDA, faster integration and a stronger platform story.
Care teams

Member practices

  • Patient management with ready-to-use, structured monitoring pathways
  • Less administrative work, proactive follow-up and data-driven decisions
More efficient care and stronger patient loyalty.
Patients

Patients

  • An app that prepares them for appointments, reminds them and guides follow-up care between visits
  • Available on iOS, Android and as a web app
Better adherence and more confidence between visits.
For care teams

Care teams keep every patient's health in view.

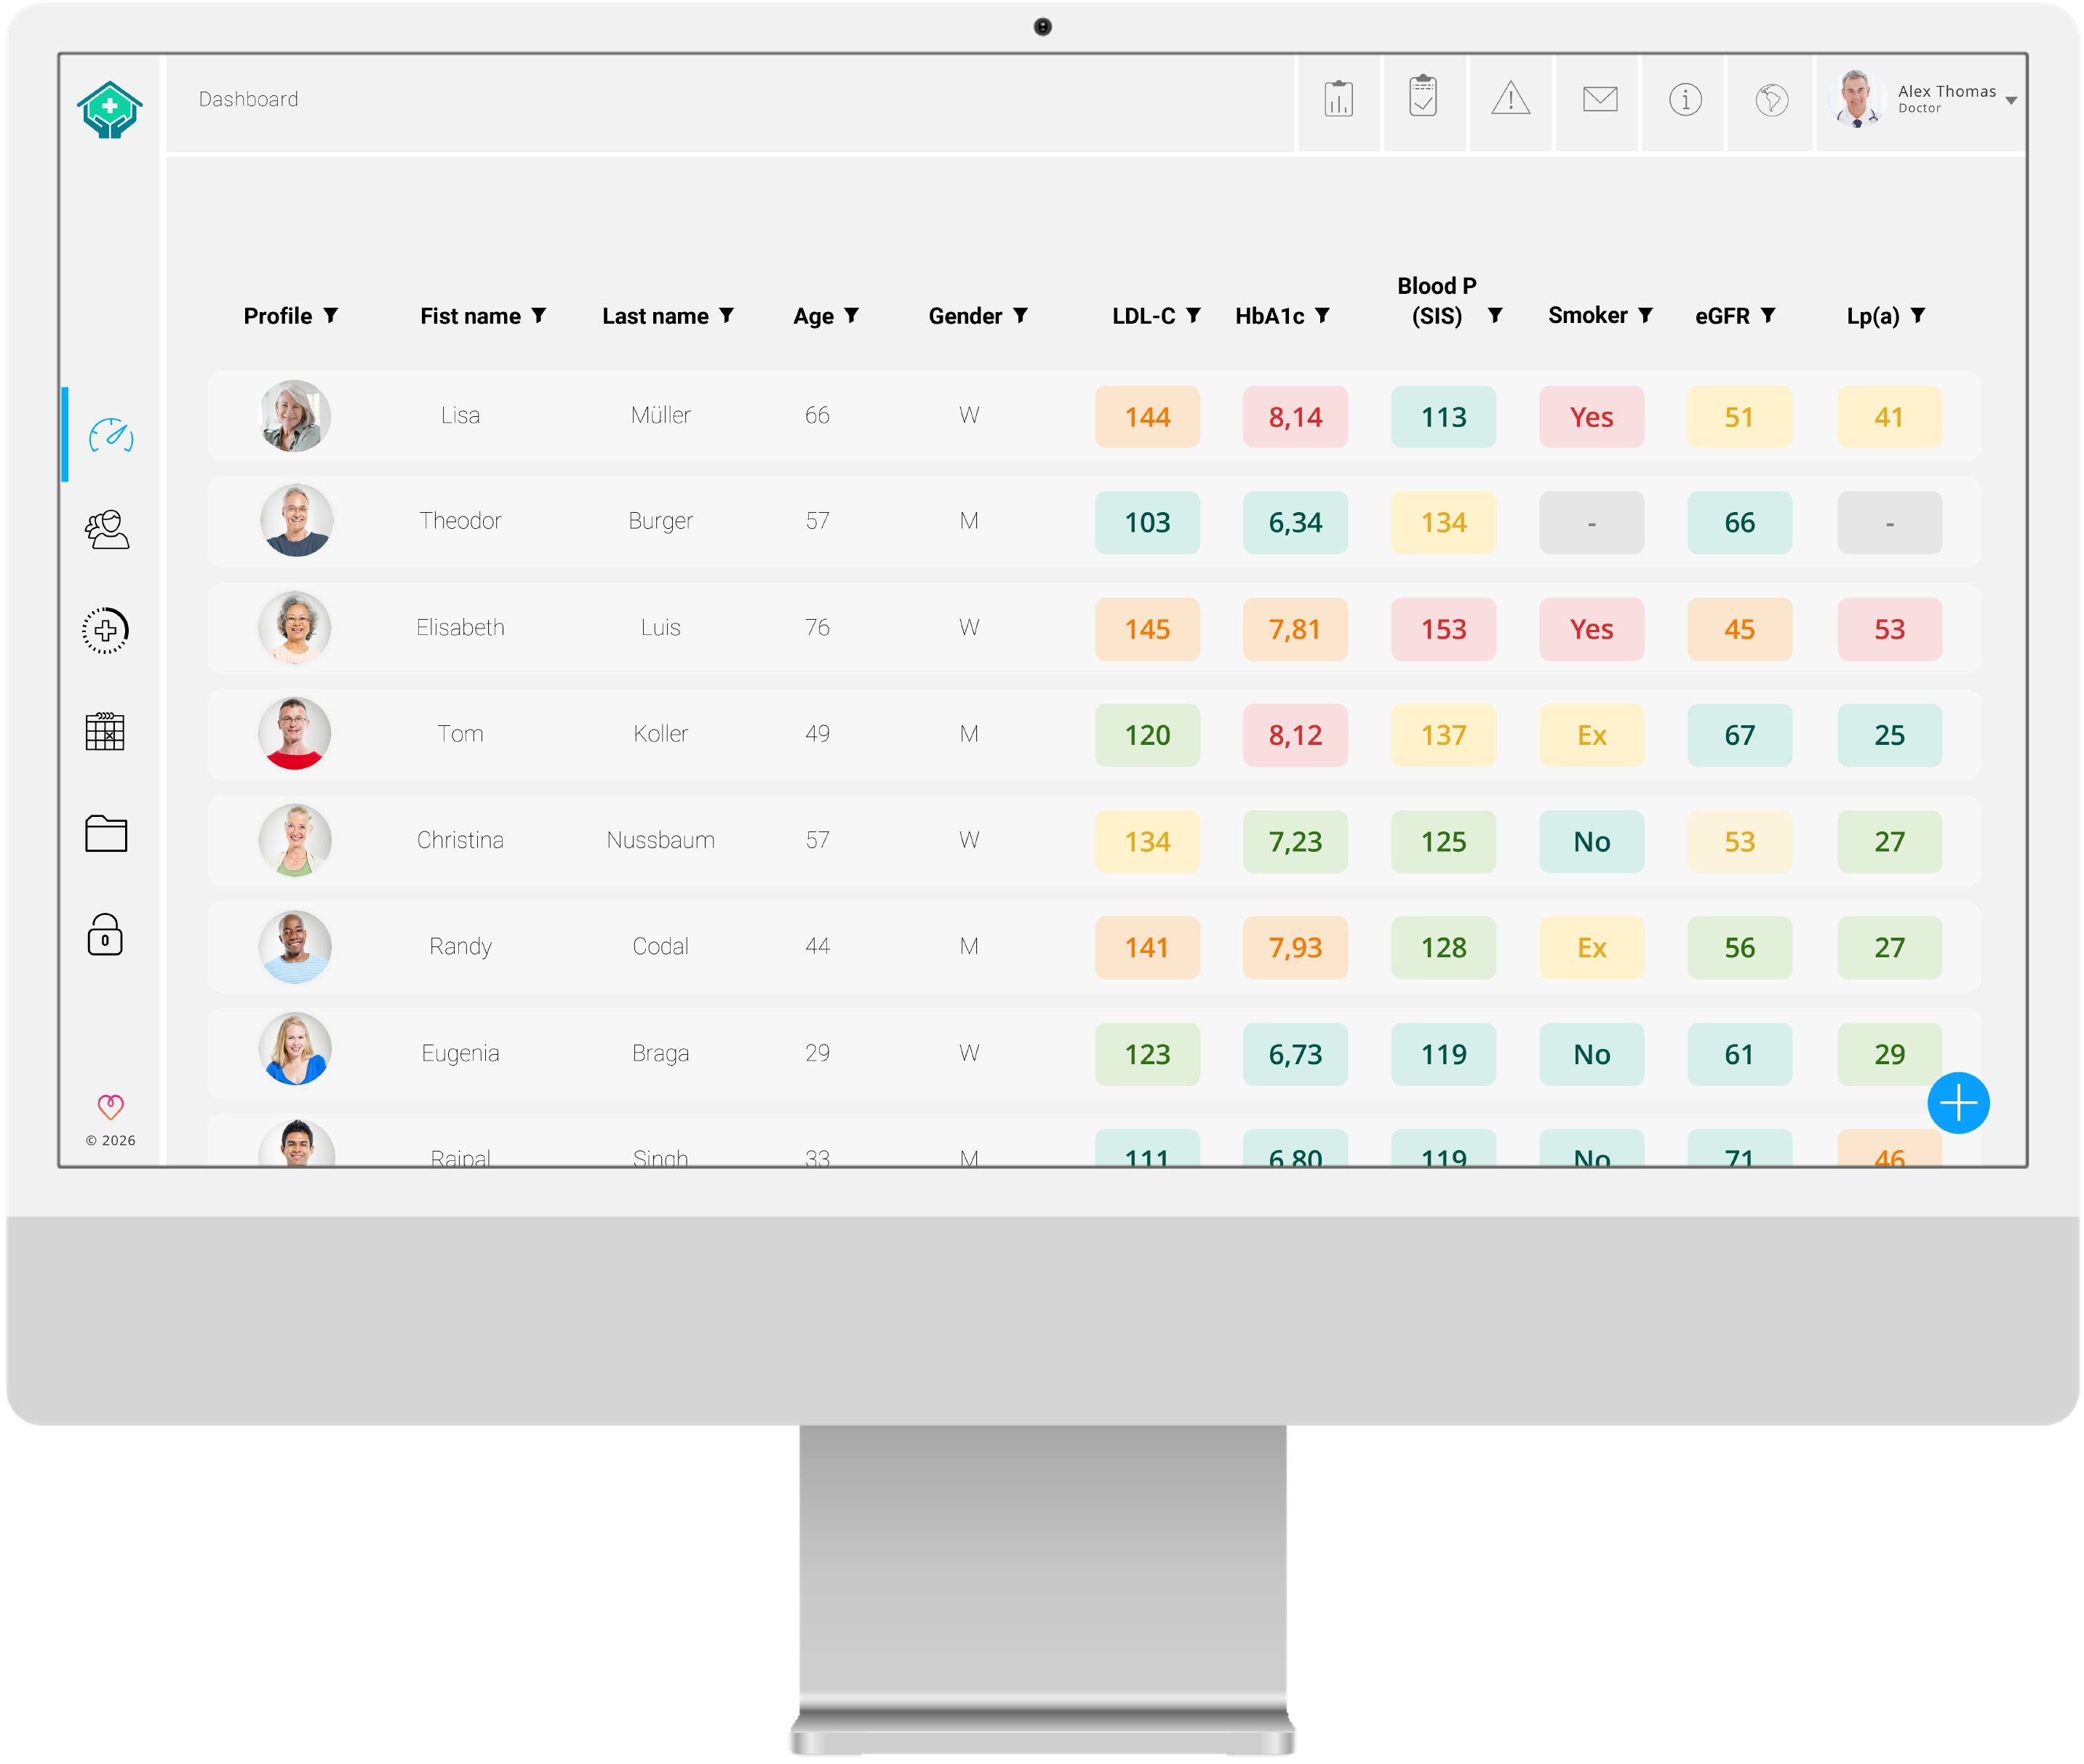
  • Patient overview: A symptom heatmap and triage function automatically prioritize who needs attention first. Real-time flag critical values immediately. Doctor dashboard placeholder 1
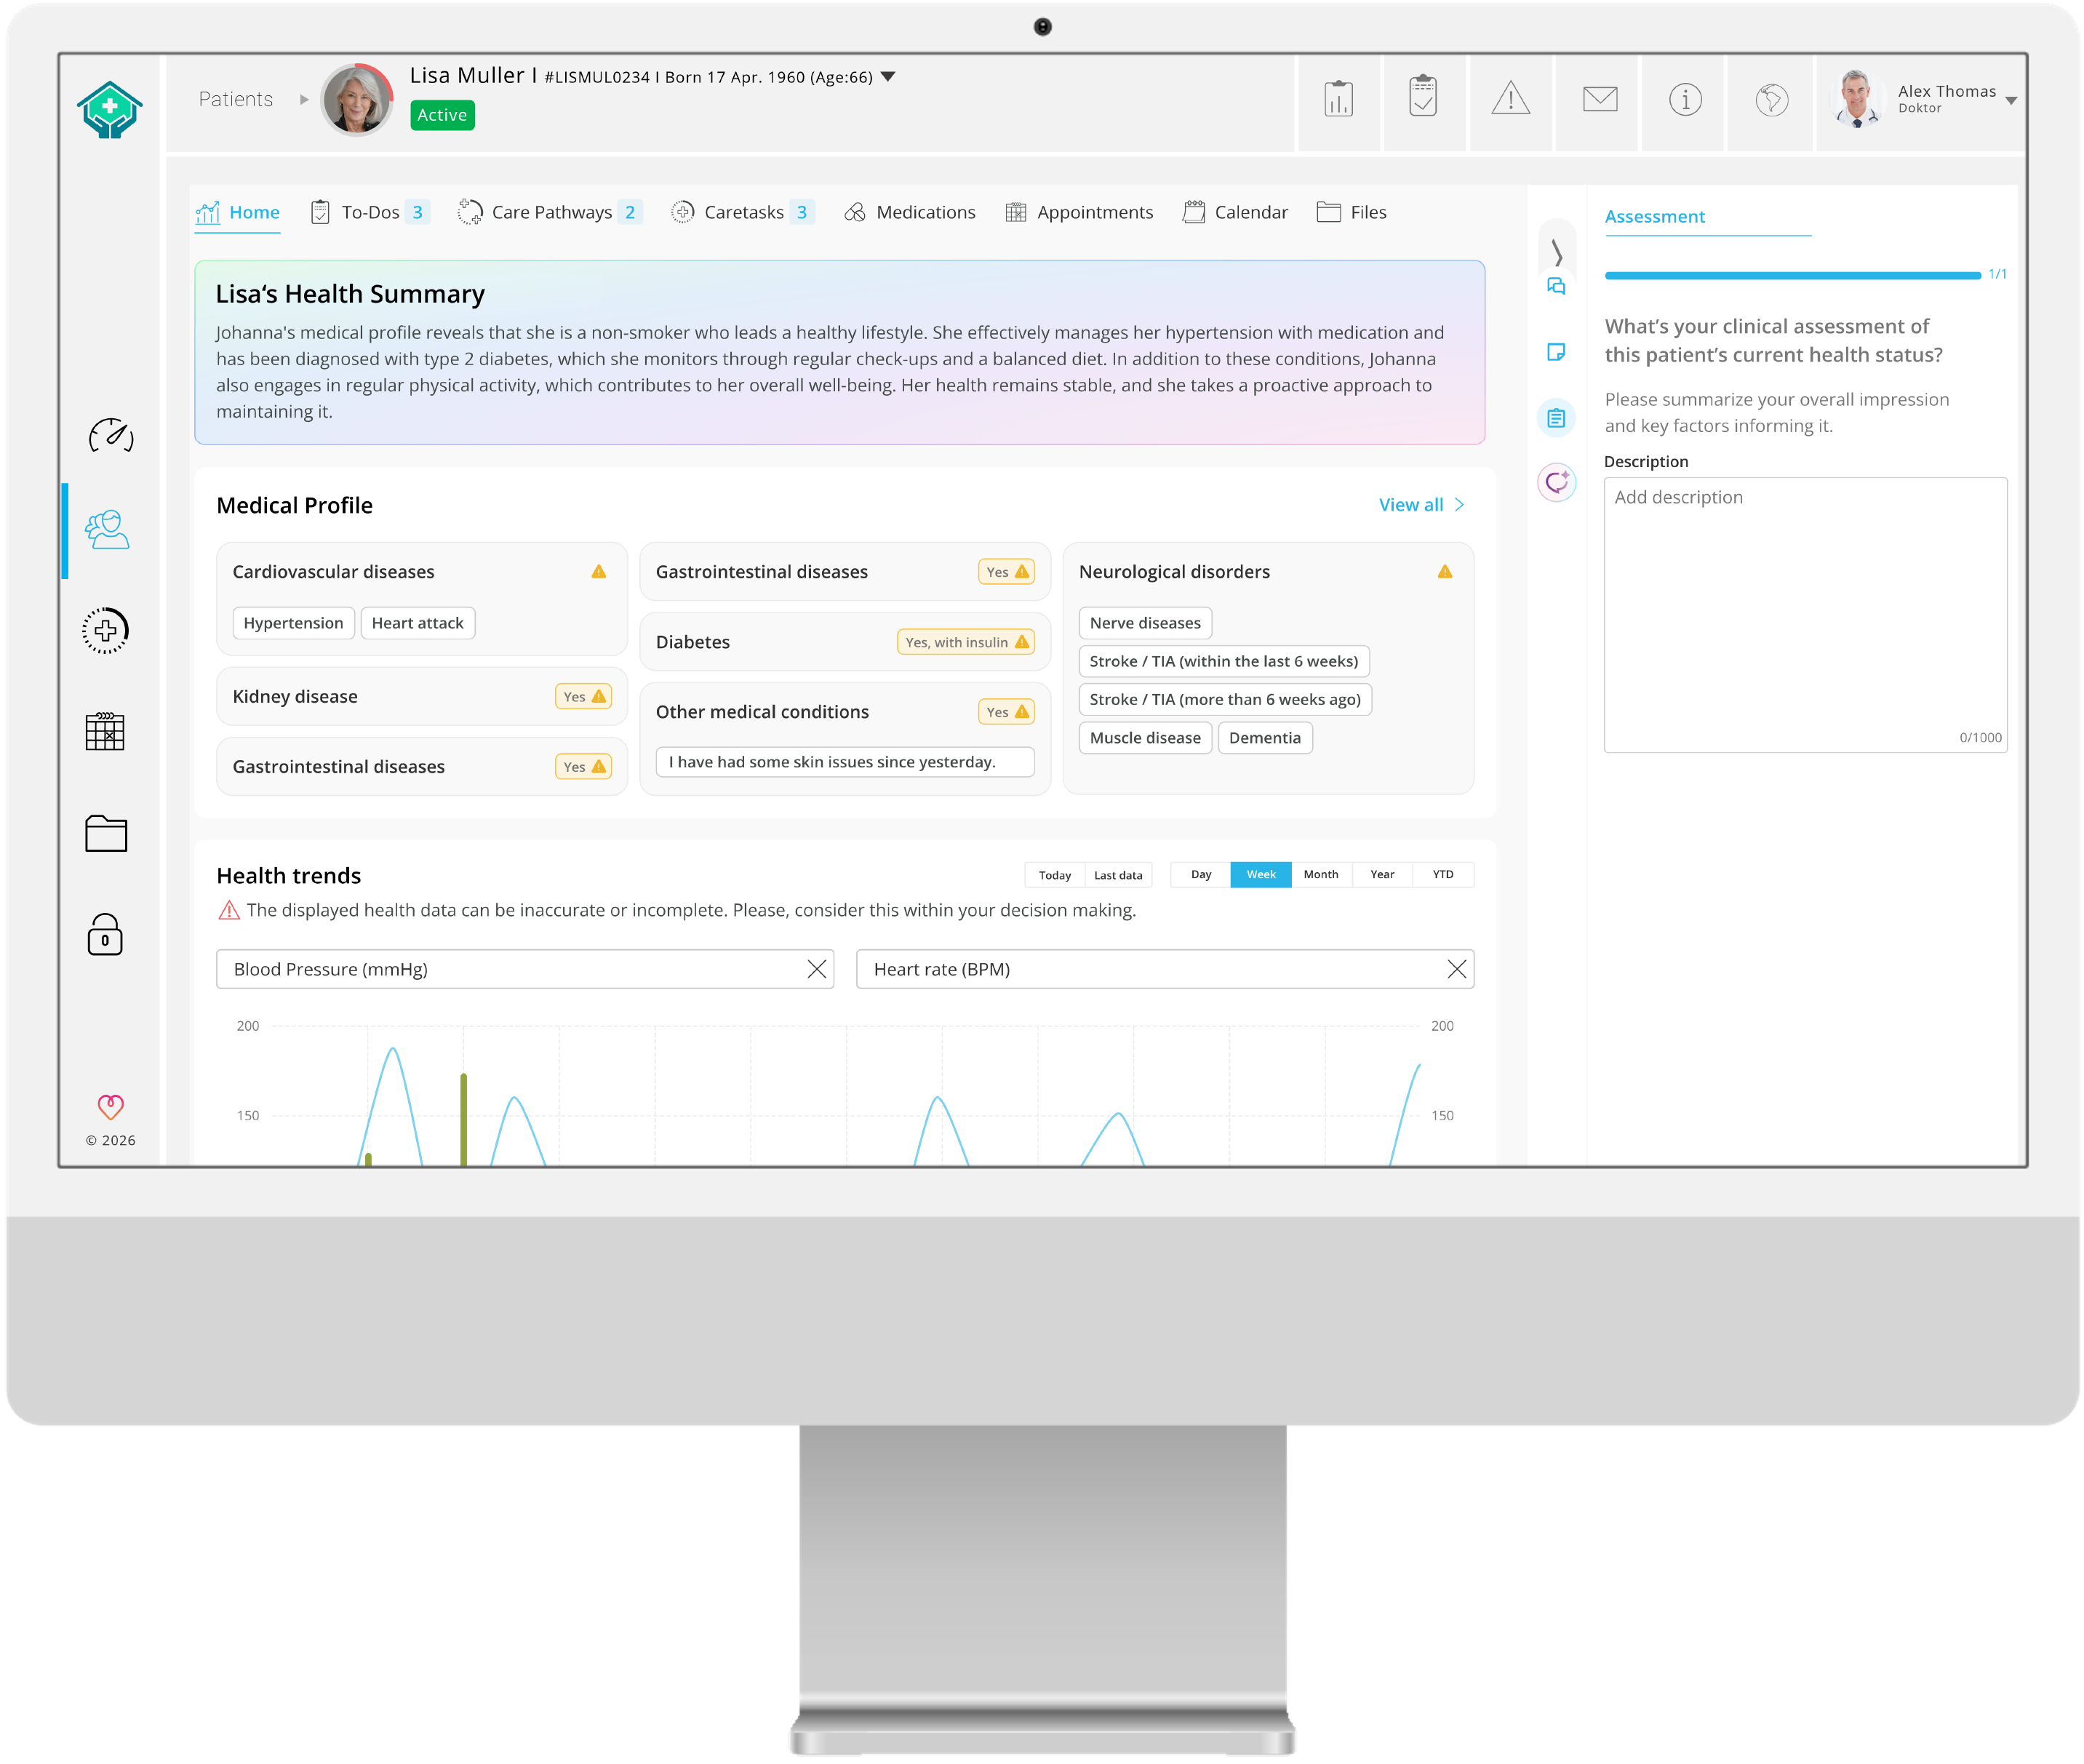
  • Patient insights: AI summaries, trend curves and medication overviews. Reports can be transferred automatically into the EHR.
  • Calendar and communication: Appointment scheduling with optional pre-evaluation, plus chat and encrypted video consultation.
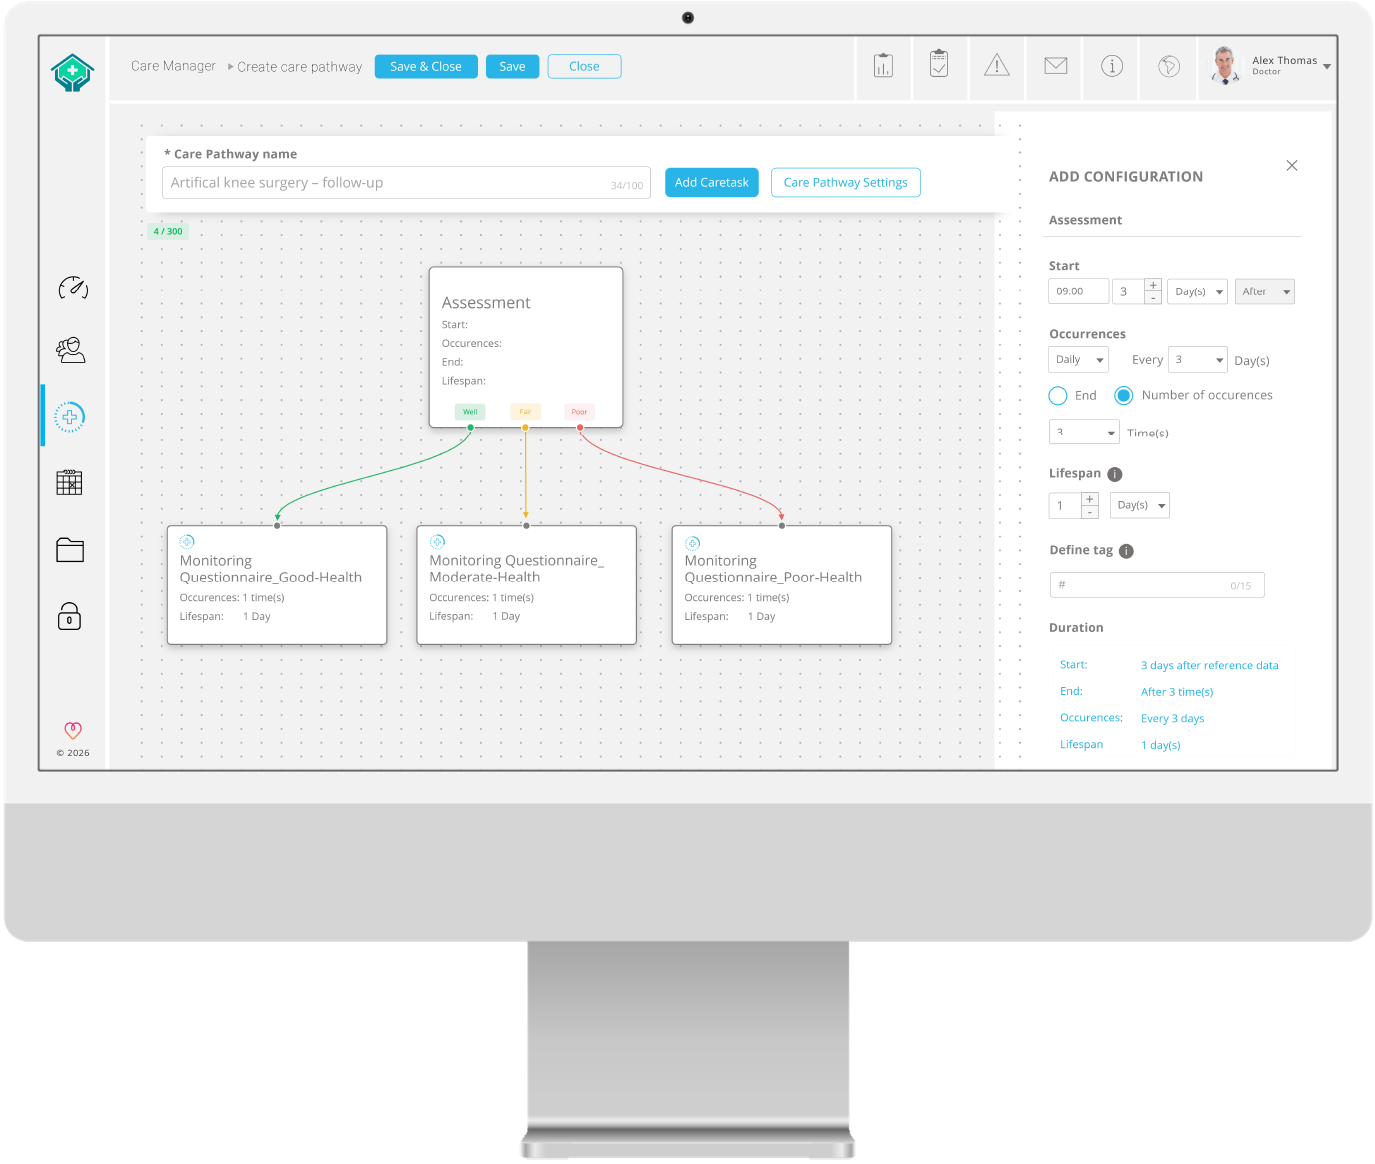
  • No-code content management: Practices  can create their own content and link it to the matching care pathways. Doctor dashboard placeholder 4
Network orchestration

One layer connects every practice and patient.

Each practice keeps its own team and its own EHR. myoncare links every site to its patients and to network leadership, so care follows the same pathways everywhere.

You decide per site and per role who may view, document or release which data.
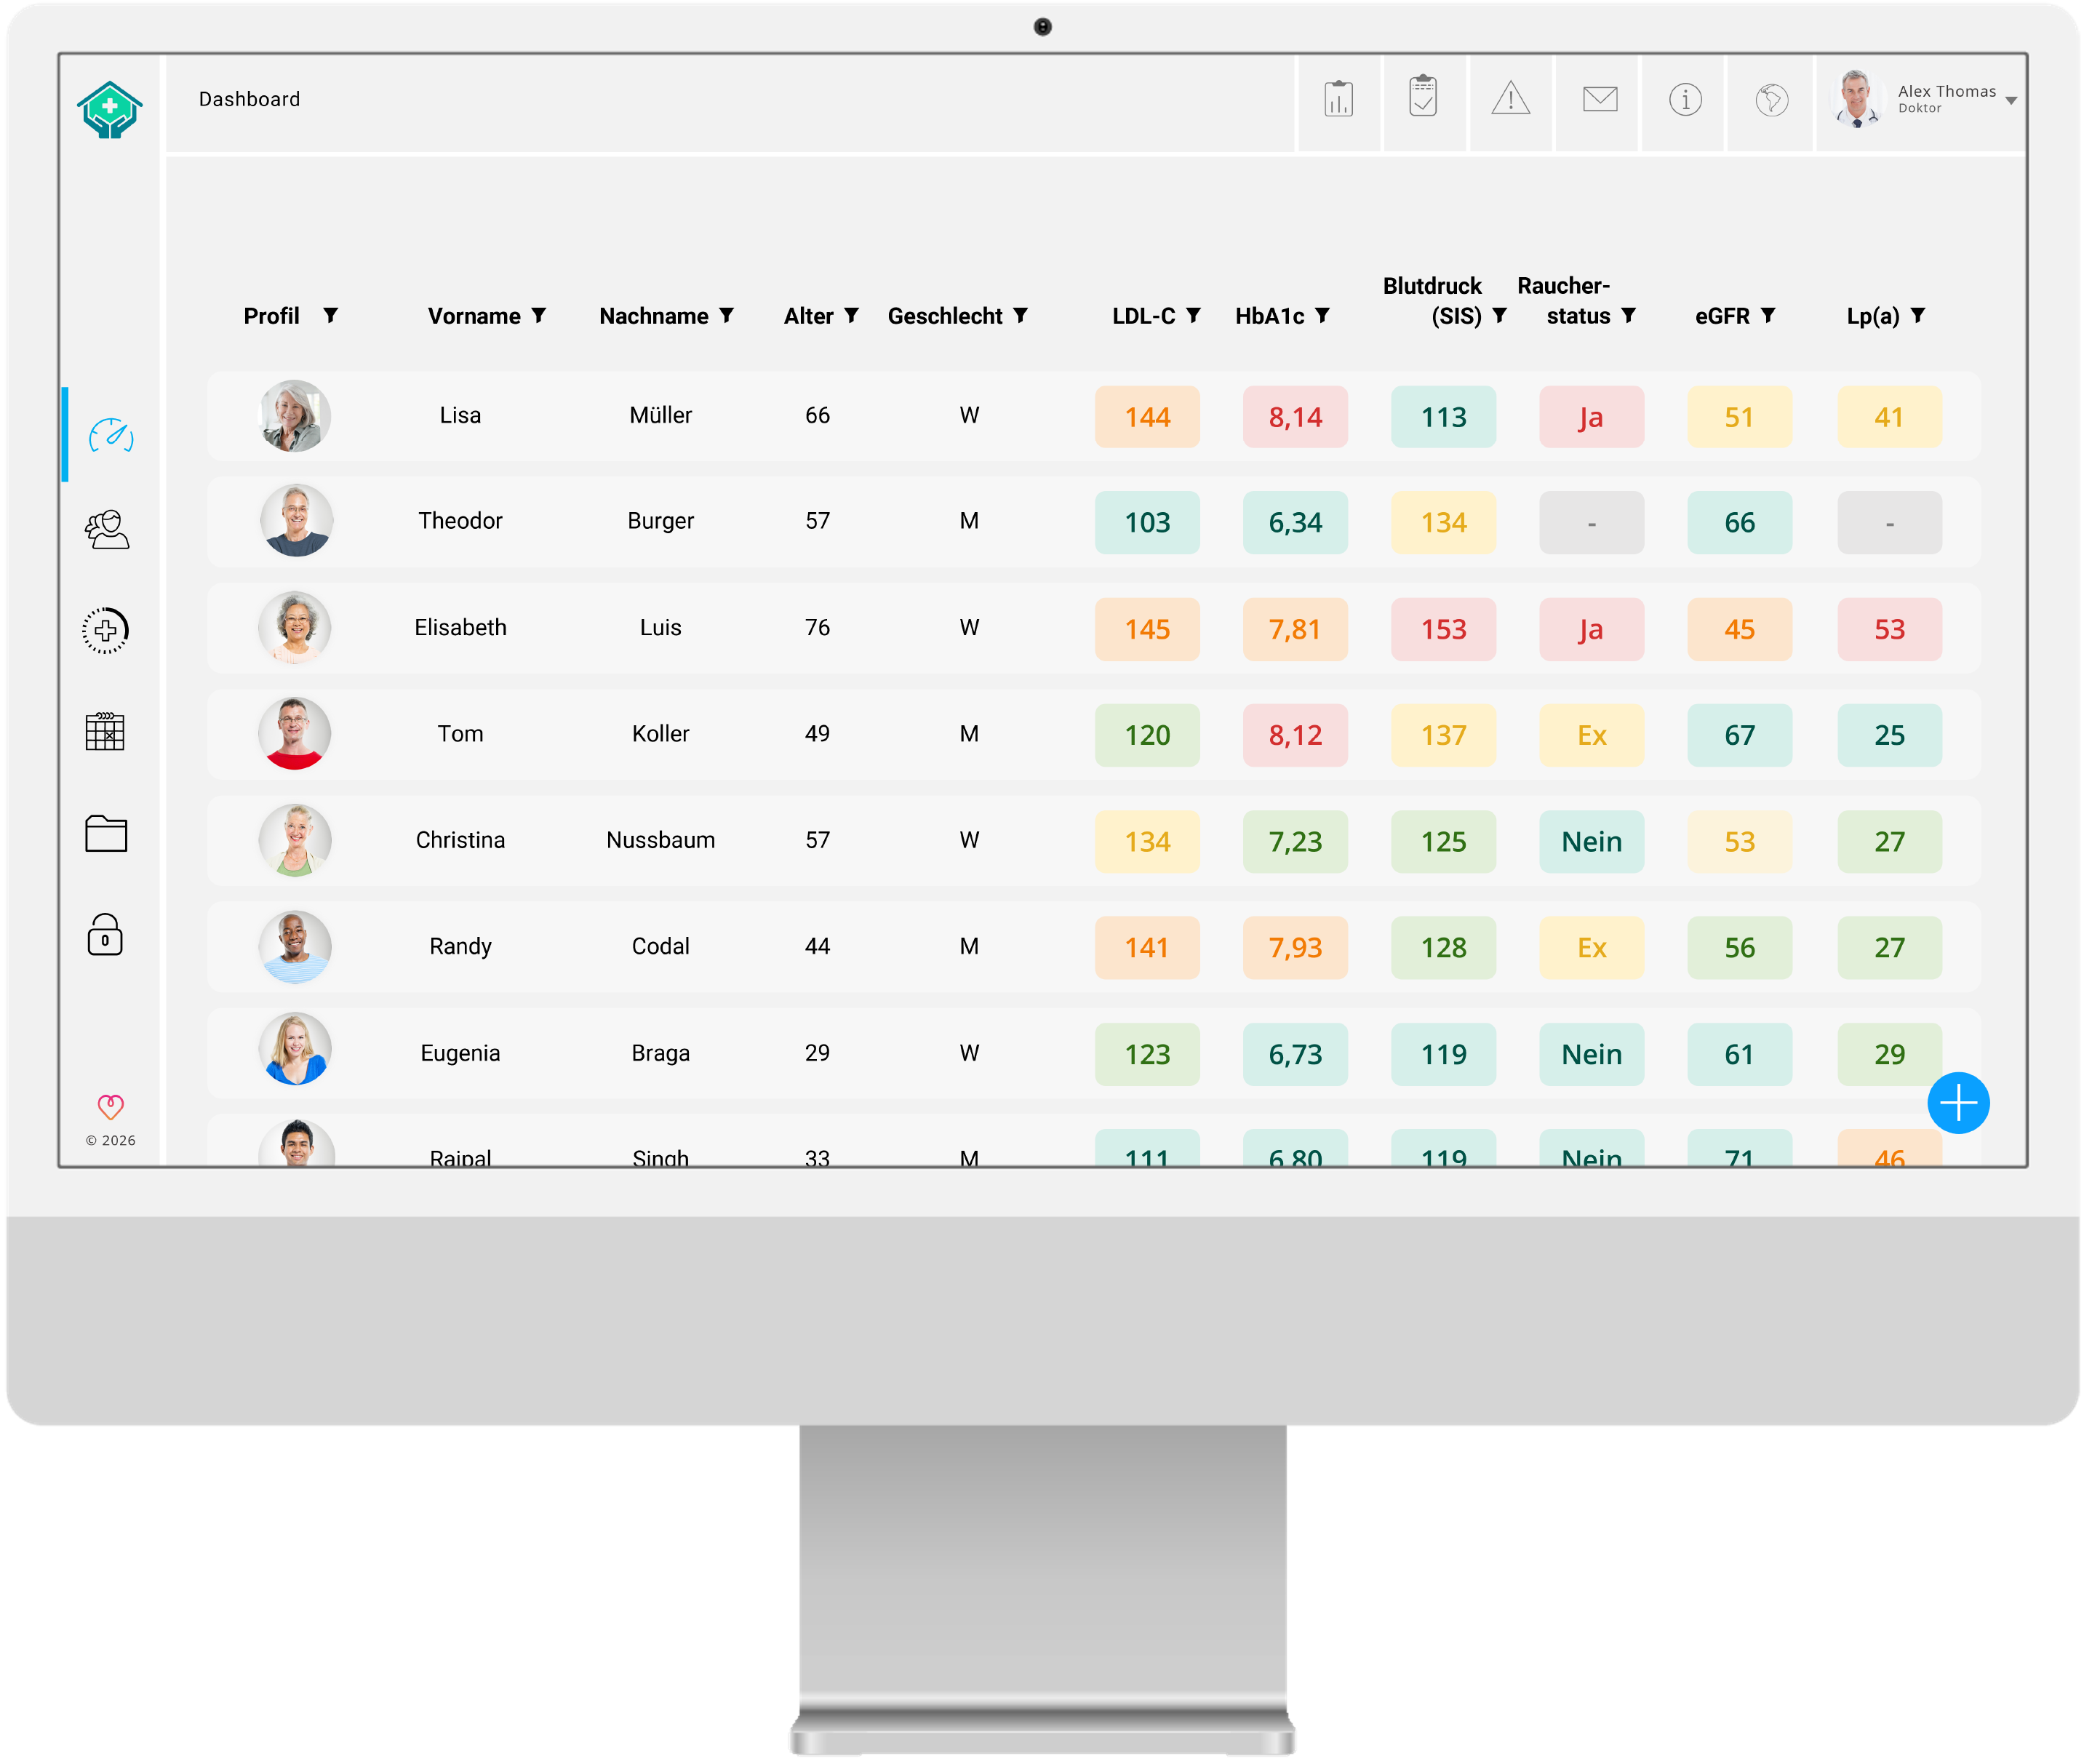
myoncare physician dashboard
myoncare platform
Primary care
Cardiology
At Home
Orthopedics
On RPM
In CCM

How it works

On top of your existing setup, not instead of it.

No rip-and-replace. myoncare connects to the systems your practices already run and adds the care and data workflows around them.
Step 1

Connect your EHRs

myoncare connects to existing practice management systems via HL7 FHIR and APIs, so patient data flows without duplicate entry.
HL7 FHIR · API
Step 2

Enroll patients & deploy pathways

Patients onboard via the myoncare app. Structured monitoring pathways for chronic disease, post-intervention or preventive care go live right away.
No-code · All indications
Step 3

Collect data & trigger alerts

Patients record vital signs, questionnaires (PROMs) and wearable data. When a predefined threshold is crossed, the care team is notified.
Real-time · Wearables
Step 4

Document for reimbursement

Interactions, monitoring data and clinical activities are documented in a structured way. This is the basis practices need to bill RPM, RTM and CCM codes.
RPM · RTM · CCM
Step 5

Analyze & benchmark

Leadership tracks enrollment, outcomes and performance across all practices in one set of network-wide dashboards.
Network-wide KPIs
Impact calculator

Estimate the impact for your network.

Start with our example primary care practice, then enter your own network profile. Each lever shows its formula and assumptions. Switch off anything that doesn't apply to you.

Your network profile
$
Example: $2.3M
%
Remote monitoring (RPM/RTM)Revenue opportunity
$0
Assumptions & formula
%
Practices that adopted remote physiologic monitoring grew Medicare revenue by 20.0% vs. matched practices [1].

Revenue per site × Medicare share × increase

Chronic care management (CCM)Revenue opportunity
$0
Assumptions & formula
Example: 100–150 eligible patients per practice.
$
Blend of CPT 99490 (≈ $66) and 99487 (≈ $144), CY 2026 national averages [2].

Patients × monthly reimbursement × 12 months

Fewer no-showsCost saving
$0
Assumptions & formula
$
Benchmark range $150–200 [3].
%
%
Digital engagement tools reduce no-shows by 20–40% [3].
%
Not every freed slot is refilled with a billable visit.

Physicians × appointments × (rate today − new rate) × lost revenue × share recovered

Fewer readmissionsCost saving
$0
Assumptions & formula
%
%
Published range 25–50%; conservative value used [4].
$
%
Most savings accrue to payers and hospitals. Raise this if you hold shared-savings or risk contracts.

Patients × readmission rate × reduction × cost × network share

Lower administrative costCost saving
$0
Assumptions & formula
Of ~53 calls per physician per day; self-service booking and structured follow-up [5].
$

(Physicians × calls × minutes × workdays + no-shows avoided × minutes) ÷ 60 × hourly cost

Thank you! Your submission has been received!
Oops! Something went wrong while submitting the form.

Important notes on this estimate

This calculator is for illustration only. It combines publicly available benchmarks with example assumptions to show how the levers could add up. It is not a forecast, offer or guarantee of revenue, savings, reimbursement or valuation, and myoncare makes no representation or warranty as to the accuracy or completeness of the results.

Actual results depend on your patient mix, enrollment, documentation, payer contracts, local fee schedules, staffing and implementation. Figures are gross: they do not deduct myoncare fees, device and logistics costs, or clinical staff time. Reimbursement requires that all applicable CMS and payer billing requirements are met (for example patient consent, time and data-transmission thresholds). The remote-monitoring benchmark comes from an observational study and may overlap with the CCM lever.

myoncare does not provide billing, legal, tax or financial advice. Please consult your own advisors. Your inputs stay in your browser and are not stored or sent.

Sources

  1. Tang M, Stern AD, Marcondes F, Mehrotra A. Practices that adopted remote physiologic monitoring increased Medicare revenue and outpatient visits. Health Affairs, Nov 2025. PubMed
  2. CMS Physician Fee Schedule, CY 2026: national average payment for CPT 99490, 99487, 99489. Rates vary by locality. cms.gov
  3. No-show rate and impact of digital reminders: graham-center.org; ahrq.gov. Lost revenue per missed visit: vitalhealthservice.com.
  4. Readmission cost and rates, RPM effect: pmc.ncbi.nlm.nih.gov; journals.sagepub.com; healthviewx.com.
  5. Call volume and handling time: sprucehealth.com; pmc.ncbi.nlm.nih.gov. Staff cost: healthit.gov; oliverwyman.com.

Lassen Sie uns Versorgung gemeinsamskalierbar machen.

Ob einzelne Praxis, Klinik oder ganze Region: In einem kurzen Gespräch zeigen wir Ihnen, wie myoncare in Ihrem Umfeld konkret wirkt, mit messbaren Ergebnissen statt vager Pilotprojekte.

Termin vereinbaren